
Page 88 - UBF AR 2018 - E Version
P. 88
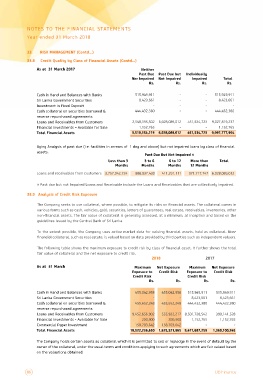
NOTES TO THE FINANCIAL STATEMENTS
Year ended 31 March 2018

33. 	 RISK MANAGEMENT (Contd...)

33.8 Credit Quality by Class of Financial Assets (Contd...)

As at 31 March 2017                                             Neither
                                                              Past Due
                                                         Nor Impaired       Past Due but        Individually        Total
                                                                            Not Impaired            Impaired           Rs.
                                                                       Rs.                                   Rs.
                                                                                          Rs.

Cash in Hand and Balances with Banks 	                   515,949,911 - - 515,949,911
Sri Lanka Government Securities	                            8,423,661 - - 8,423,661
Investment in Fixed Deposit	                                            - -- -
Cash collateral on securities borrowed &
reverse repurchased agreements	                          444,432,380 - - 444,432,380
Loans and Receivables from Customers
Financial Investments – Available for Sale	              2,548,195,502      6,028,089,012       451,534,723         9,027,819,237
Total Financial Assets                                        1,152,765                      -                 -         1,152,765

                                                         3,518,154,219      6,028,089,012       451,534,723         9,997,777,954

Aging Analysis of past due (i.e. facilities in arrears of 1 day and above) but not impaired loans by class of financial

assets.                                                        Past Due But Not Impaired *

                                            Less than 3          3 to 6     6 to 12             More than           Total
                                                 Months        Months       Months              12 Months

Loans and receivables from customers 3,757,042,724 888,037,430 411,291,111 971,717,747 6,028,089,012

        * Past due but not Impaired Loans and Receivable include the Loans and Receivables that are collectively impaired.

33.9 Analysis of Credit Risk Exposure

        The Company seeks to use collateral, where possible, to mitigate its risks on financial assets. The collateral comes in
        various forms such as cash, vehicles, gold, securities, letters of guarantees, real estate, receivables, inventories, other
        non-financial assets. The fair value of collateral is generally assessed, at a minimum, at inception and based on the
        guidelines issued by the Central Bank of Sri Lanka.

        To the extent possible, the Company uses active market data for valuing financial assets, held as collateral. Non-
        financial collateral, such as real estate, is valued based on data provided by third parties such as independent valuers.

The following table shows the maximum exposure to credit risk by class of financial asset. It further shows the total

fair value of collateral and the net exposure to credit risk.  2018                             2017

As at 31 March                                             Maximum Net Exposure                   Maximum Net Exposure
                                                         Exposure to Credit Risk                Exposure to Credit Risk
                                                         Credit Risk                            Credit Risk

                                                                       Rs. Rs.                                Rs. Rs.

Cash in Hand and Balances with Banks                     455,042,958        455,042,958         515,949,911         515,949,911
Sri Lanka Government Securities                                         -                  -       8,423,661           8,423,661
Cash collateral on securities borrowed &
reverse repurchased agreements                           455,652,248        455,652,248         444,432,380         444,432,380
Loans and Receivables from Customers
Financial Investments - Available for Sale                9,452,656,902       555,922,217       8,501,728,542         390,141,528
Commercial Paper Investment                                       200,900           200,900          1,152,765           1,152,765
Total Financial Assets                                                                                           -                   -
                                                             158,703,642      158,703,642
                                                         10,522,256,650     1,625,521,965       9,471,687,259       1,360,100,245

The Company holds certain assets as collateral which it is permitted to sell or repledge in the event of default by the
owner of the collateral, under the usual terms and conditions applying to such agreements which are fair valued based
on the valuations obtained.

86 UB Finance