
Page 84 - UBF AR 2018 - E Version
P. 84
NOTES TO THE FINANCIAL STATEMENTS
Year ended 31 March 2018
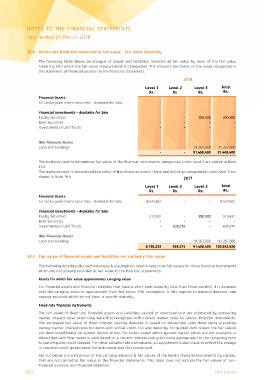
32.4 Assets and liabilities measured at fair value - fair value hierarchy
The following table shows an analysis of assets and liabilities recorded at fair value by level of the fair value
hierarchy into which the fair value measurement is categorised. The amounts are based on the value recognised in
the statement of financial position in the financial statements.
2018
Financial Assets Level 1 Level 2 Level 3 Total
Sri Lanka government securities - Available for Sale Rs. Rs. Rs. Rs.
- - - -
Financial Investments – Available for Sale
Equity Securities - - 200,900 200,900
Debt Securities
Investments in Unit Trusts -- --
-- --
Non Financial Assets - - 91,267,500 91,267,500
Land and buildings - - 91,468,400 91,468,400
The methods used to determined fair value of the financial instruments categorised under level 3 are stated in Note
15.2
The methods used to determined fair value of Non financial assets - land and buildings categorized under level 3 are
stated in Note 19.4 2017
Financial Assets Level 1 Level 2 Level 3 Total
Sri Lanka government securities - Available for Sale Rs. Rs. Rs. Rs.
- -
Financial Investments – Available for Sale 8,423,661 8,423,661
Equity Securities
Debt Securities 312,591 - 200,900 513,491
Investments in Unit Trusts - - - -
- 639,274 -
Non Financial Assets 639,274
Land and buildings
- - 91,267,500 91,267,500
8,736,252 639,274 91,468,400 100,843,926
32.5 Fair value of financial assets and liabilities not carried at fair value
The following describes the methodologies & assumptions used to determine fair values for those financial instruments
which are not already recorded at fair value in the financial statements:
Assets for which fair value approximates carrying value
For financial assets and financial liabilities that have a short term maturity (less than three months) it is assumed
that the carrying amounts approximate their fair value. This assumption is also applied to demand deposits, and
savings accounts which do not have a specific maturity.
Fixed rate financial instruments
The fair value of fixed rate financial assets and liabilities carried at amortised cost are estimated by comparing
market interest rates when they were first recognised with current market rates for similar financial instruments.
The estimated fair value of fixed interest bearing deposits is based on discounted cash flows using prevailing
money–market interest rates for debts with similar credit risk and maturity. For quoted debt issued, the fair values
are determined based on quoted market prices. For notes issued where quoted market prices are not available, a
discounted cash flow model is used based on a current interest rate yield curve appropriate for the remaining term
to maturity and credit spreads. For other variable rate instruments, an adjustment is also made to reflect the change
in required credit spread since the instrument was first recognised.
S et out be low is a c ompariso n of the carrying amounts & fair values of the Bank’s financial instruments by classes,
that are not carried at fair value in the financial statements. This table does not include the fair values of non–
financial assets & non–financial liabilities.
82 UB Finance