
Page 90 - UBF AR 2018 - E Version
P. 90
88 UB Finance STATEMENT OF CHANGES IN EQUITY
Year ended 31 March 2018
33. RISK MANAGEMENT (Contd...)
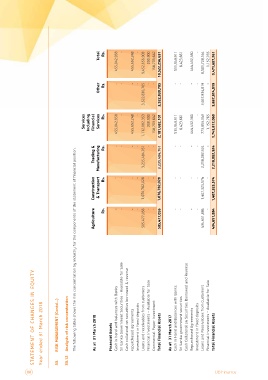
33.12 Analysis of risk concentration
The following table shows the risk concentration by industry for the components of the statement of financial position.
As at 31 March 2018 Agriculture Construction Trading & Services Other Total
Rs. & Transport Manufacturing Including Rs. Rs.
Financial Assets Financial
Cash in hand and balances with Banks Rs. Rs.
Sri Lanka Government Securities - Available for Sale Services
Cash collateral on securities borrowed & reverse - - - Rs. - 455,042,958
repurchased agreements - - - --
Investment in fixed deposits 455,042,958
Loans and receivables from customers - - - - - 455,652,248
Financial Investments – Available for Sale - - - - -
Commercial Paper Investment 505,477,056 1,076,782,028 3,235,484,761 455,652,248 3,522,830,705
Total Financial Assets - - - - - 9,452,656,903
- - - - 200,900
505,477,056 1,076,782,028 3,235,484,761 1,112,082,353 3,522,830,705
200,900 158,703,642
10,522,256,651
158,703,642
2,181,682,101
As at 31 March 2017 - - - 515,949,911 - 515,949,911
Cash in Hand and Balances with Banks - - - 8,423,661 - 8,423,661
Sri Lanka government securities
Cash Collateral on Securities Borrowed and Reverse - - - 444,432,380 - 444,432,380
Repurchased Agreements - - - - - -
Investment in fixed deposits 434,651,884 1,407,325,574 2,218,082,924 3,667,814,819
Loans and Receivables from Customers - - - 773,853,343 - 8,501,728,544
Financial Investments – Available for Sale 434,651,884 1,407,325,574 2,218,082,924 1,152,765 3,667,814,819 1,152,765
Total Financial Assets
1,743,812,060 9,471,687,261