
Page 91 - UBF AR 2018 - E Version
P. 91
NOTES TO THE FINANCIAL STATEMENTS
Year ended 31 March 2018
33. RISK MANAGEMENT (Contd...) risk. This incorporates an assessment of expected cash
flows and the availability of high grade collateral which
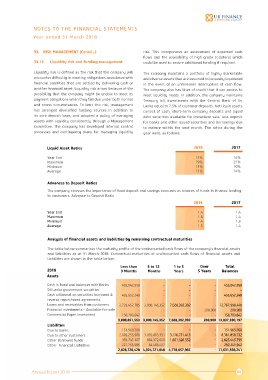
33.13 Liquidity risk and funding management could be used to secure additional funding if required.
Liquidity risk is defined as the risk that the company will The company maintains a portfolio of highly marketable
encounter difficulty in meeting obligations associated with and diverse assets that are assumed to be easily liquidated
financial liabilities that are settled by delivering cash or in the event of an unforeseen interruption of cash flow.
another financial asset. Liquidity risk arises because of the The company also has lines of credit that it can access to
possibility that the company might be unable to meet its meet liquidity needs. In addition, the company maintains
payment obligations when they fall due under both normal Treasury bill investments with the Central Bank of Sri
and stress circumstances. To limit this risk, management Lanka equal to 7.5% of customer deposits. Net liquid assets
has arranged diversified funding sources in addition to consist of cash, short–term company deposits and liquid
its core deposit base, and adopted a policy of managing debt securities available for immediate sale, less deposit
assets with liquidity consistently through a Management for banks and other issued securities and borrowings due
Committee. The company has developed internal control to mature within the next month. The ratios during the
processes and contingency plans for managing liquidity year were, as follows:
Liquid Asset Ratios 2018 2017
Year End 13% 14%
Maximum 19% 21%
Minimum 11% 10%
Average 13% 14%
Advances to Deposit Ratios
The company stresses the importance of fixed deposit and savings accounts as sources of funds to finance lending
to customers. Advance to Deposit Ratio
2018 2017
Year End 1.4 1.4
Maximum 1.6 1.4
Minimum 1.4 1.3
Average 1.5 1.4
Analysis of financial assets and liabilities by remaining contractual maturities
The table below summarises the maturity profile of the undiscounted cash flows of the company’s financial assets
and liabilities as at 31 March 2018. Contractual maturities of undiscounted cash flows of financial assets and
liabilities are shown in the table below;
2018 Less than 3 to 12 1 to 5 Over Total
Assets 3 Months Months Years 5 Years Balances
Cash in hand and balances with Banks 455,042,958 - - - 455,042,958
- - --
Sri Lanka government securities - - - - 455,652,248
Cash collateral on securities borrowed & 455,652,248 3,000,145,352 7,028,392,392
- -
reverse repurchased agreements - -
Loans and receivables from customers 2,739,452,705 3,000,145,352 7,028,392,392 - 12,767,990,449
Financial investments – Available-for-sale - - - 200,900 200,900
3,095,863,351 3,176,731,413
Commercial Paper Investment 158,703,642 1,601,326,552 - 158,703,642
864,372,060
3,808,851,553 64,486,437 - 200,900 13,837,590,197
4,024,721,848 4,778,057,965
Liabilities 151,969,768 - 151,969,768
- 8,361,850,732
Due to banks - 2,825,445,799
- 292,241,942
Due to other customers 2,089,255,968 - 11,631,508,241
Other Borrowed funds 359,747,187
Other Financial Liabilities 227,755,505
2,828,728,428
Annual Report 2018 89